Cyara watchRTC
Enhance your user’s experience with WebRTC performance monitoring
watchRTC is just one part of Cyara’s extensive testRTC suite of WebRTC test tools. These tools offer you a one-stop-shop for all your WebRTC based applications and services’ testing, monitoring and support needs.
watchRTC monitors the live user traffic, allowing you to optimize your infrastructure or to view and analyze data in real time to support troubleshooting.
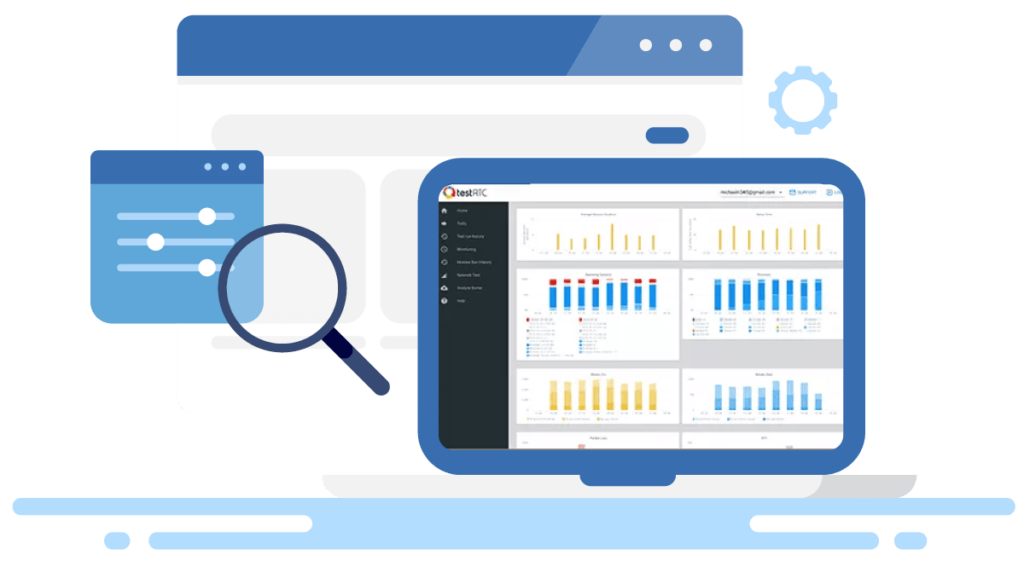
With a simple integration, you can quickly have this powerful WebRTC performance monitoring solution up and running. Once integrated, watchRTC gathers all relevant WebRTC data from the customer interactions and displays the information in an easy to digest visual dashboard.
watchRTC’s visual dashboard gives you a bird’s eye view of how your application is performing. It shows you the overall quality of your customer’s experience. You also have the power to drill down to the quality of each unique interaction, right down to the individual on a per channel level.
With Cyara’s watchRTC, you will benefit from:
Simple Integration
watchRTC’s client-side SDK is lightweight and simple to implement.

Visual Data
Quickly and easily understand how your application is performing. Get a bird’s eye view of your WebRTC metrics and KPIs including media quality and operational statistics.

Effective Filtering
Quickly troubleshoot using real data. With 20+ filtering options, you can analyze data from all angles, allowing you to pinpoint trends and issues at scale.

Intuitive Notifications
Receive instant notification of important WebRTC events. You can even customize thresholds for specific metrics.

Detailed History
Drill down to specific areas of interest from current and past sessions, and analyze historical data for quick and efficient troubleshooting.

Deep Level Drill-Down
Drill right down to a single session, individual user or a single channel (audio or video etc.) to view the most compressive and detailed information in the WebRTC testing industry.

Detailed Data Streaming
Enrich your data warehouse with a data stream of collected metrics from watchRTC, allowing you to analyze it in any way you require.
Why is WebRTC performance monitoring so important?

Gain Insights
Receive data driven user behavior insights that let you see how your infrastructure handles real usage, and what issues your customers may be experiencing.

Optimal Prioritization
Utilize the insights provided to prioritize updates and bug fixes which provide the most positive impact for your customers.

Increase Quality
Analyze the insights to understand and directly track the impact your updates have on quality and user experience.
watchRTC can help you answer questions, such as:
Do you know what your customers experience when using your application?
Do you have quick and simple access to detailed data for every WebRTC session?
Do you have a data driven priority list for improving your WebRTC infrastructure?
Do you have delays between requiring information on deployment and getting answers?
Cyara Automated CX Assurance Platform

Cyara watchRTC is part of the award-winning Cyara Automated CX Assurance Platform which enables companies to deliver better CX with less effort, cost, and risk. Cyara supports the entire CX software development lifecycle, from design to functional and regression testing, load testing, and production monitoring, ensuring enterprises can build flawless customer journeys across voice and digital channels.
Resources
White Paper: What to Look For in a WebRTC Testing Tool

eBook: Guide to Effective Number Testing

Learn More
See how the Cyara Automated Customer Experience Assurance Platform can help you achieve your CX Assurance goals, and delight your customers.